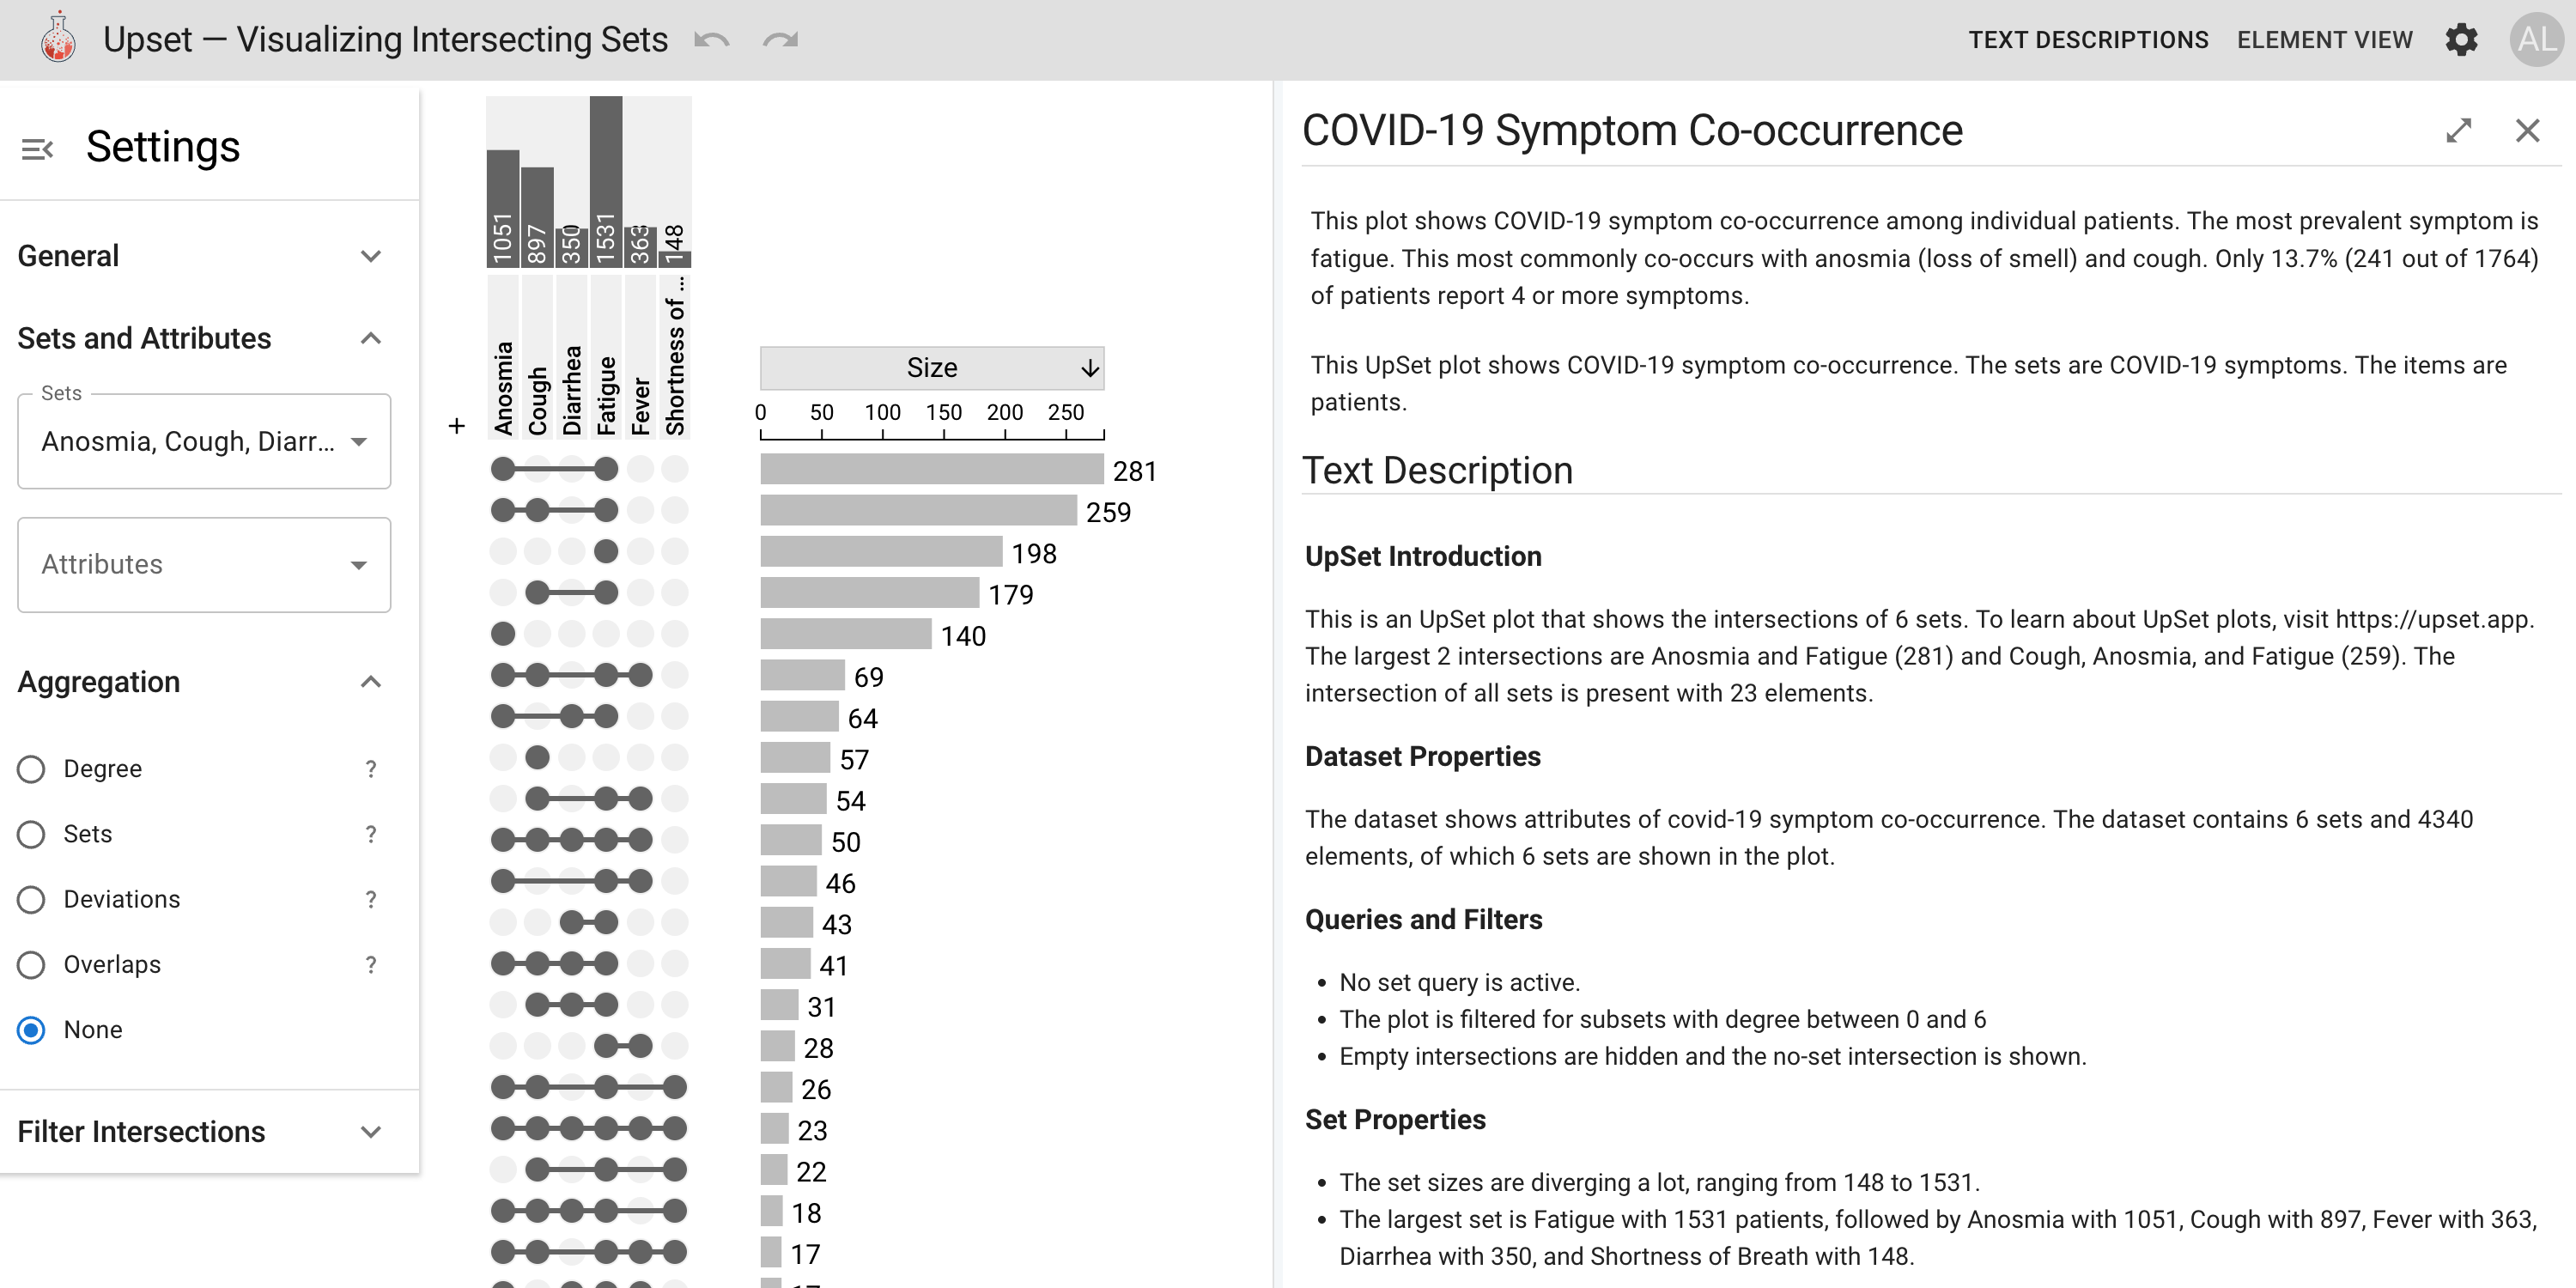
About

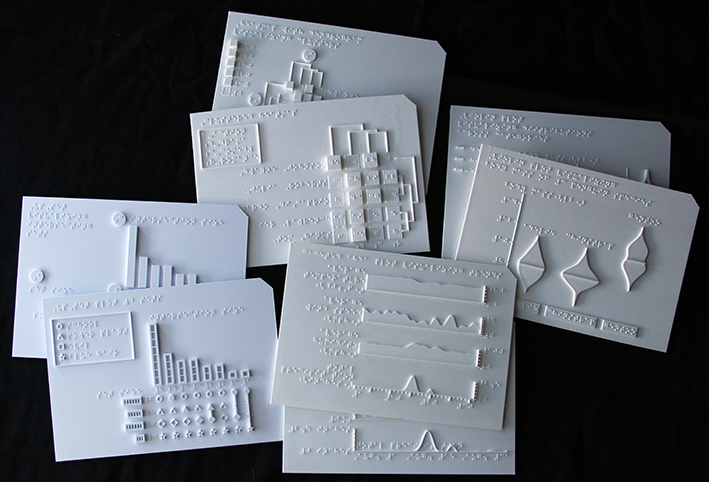
We are a team of visualization researchers at Graz University of Technology and the University of Utah. Our interests include the process of designing and developing visualizations, visualization for biology, visualization frameworks, and, more generally, visualization of big, heterogeneous, and complex datasets.

VDL is part of the Institute of Human-Centred Computing (HCC) at Graz University of Technology. VDL started at the Scientific Computing and Imaging Institute and the School of Computing at the University of Utah and remains affiliated with both.

Blog And News

Blog Post: Learning with Hands: Making Complex Chart Types Accessible 8 Aug 2025
If you’ve ever struggled to read a complicated chart, imagine trying to understand it without ever seeing it at all. For blind and low-vision (BLV) individuals, that’s not just a thought experiment—it’s a daily reality. Most of the time, BLV readers rely on alternative text (alt text) to access charts. Alt text works well for something simple, like a bar chart. But for more complex visualizations—think violin plots—it can be confusing. Without a mental model of the chart type, even the clearest description can seem abstract and incomplete. That’s where our research comes in. Here, we explored how 3D-printed tactile “template charts” can help BLV individuals learn chart types. Rather than aiming to represent a dataset, these templates help BLV individuals grasp the core concept of each chart type.

A photo of eight 3D-printed tactile charts from our design iteration. There are four chart types—UpSet plots, clustered heatmaps, violin plots, and faceted line charts—with two design variations for each type.
More...
News: VDL is Moving to Austria 30 Jul 2025
The lab is starting a new chapter, with Alex moving to TU Graz, Austria

A photo of the Clocktower in Graz, Austria.


After an incredible decade at the University of Utah, the Visualization Design Lab (VDL) is entering a new chapter: the lab is partially relocating to Graz University of Technology (TU Graz) in Austria. This will be a gradual transition: only Alex will be moving, while the rest of the team remains in Utah. For the foreseeable future, the lab will operate across two continents.

VDL’s new home in Austria will be the Institute of Human-Centred Computing at TU Graz.

Alex will be hiring a PhD student and a Postdoctoral Fellow in Graz. Check out the positions page for details.

A Brief History of the Visualization Design Lab

The Visualization Design Lab was founded when Alex joined the University of Utah and teamed up with Miriah in 2015. From then until 2021, Miriah and Alex co-directed the lab, leading numerous projects and mentoring many students.

In 2021, Miriah moved to Linköping University in Sweden, where she founded the Visualization and Interaction Design Group.

In 2025, Alex returned to his alma mater in Graz to continue VDL’s research mission at TU Graz.

This website will reflect the new phase of the lab in Austria, while continuing to preserve the history, people, and publications from the Utah chapter. For archival purposes, the final version of the Utah VDL site will remain available at
https://vdl.sci.utah.edu.

More...
Blog Post: Making Data Visualizations Talk: Accessible Text Descriptions for UpSet Plots 7 Jun 2025
Data visualizations in scientific journals are essential for understanding the content of an article. However, visualizations typically are inaccessible for blind or low-vision users. A common remedy are text descriptions for the visualizations. Yet, text descriptions are difficult to generate for advanced plots, such as UpSet Plots. Here, we introduce methods to generate short and long text descriptions for UpSet Plots.

A screenshot of an UpSet plot and the accompanying text description on the website https://upset.multinet.app. The plot shows data about covid symptoms. User interface elements for interacting with the plot are visible on the left. The text description is shown on the right.
More...
News: Max Lisnic Successfully Defends Dissertation 15 May 2025
Congratulations to Max for completing his PhD!

Group photo with Max celebrating his PhD Defense!

Max Lisnic successfully defended his dissertation on “Designing Resilient Visualizations Toward More Accurate Data Discourse”. Max was co-advised by Marina Kogan and Alex Lex. The committee was completed by Kate Isaacs, Vineet Pandey, and Crystal Lee.

Max will join WPI as an assistant professor this fall!

Congrats, and good luck with your next steps!

Max Speaking Max and the Group Max' Cake

More...

Recent Publications